
The Forex market, with a capitalization of $5 trillion and over $5 trillion in daily traded volumes, is the planet’s biggest marketplace. The robust depth and liquidity of the Forex market provide traders with a high degree of efficiency due to its big size and activity. For many traders, Forex trading is an excellent method for achieving almost any financial objective.
There are several similarities between Forex and futures trading, but the most important distinction is that in the case of a currency pair, exchange-traded funds (ETFs) may be used instead of real money.
The key differences between ETFs and mutual funds are that the former has lower costs and better tax efficiency than their cash equivalent. Thus, they offer investors a potentially more advantageous risk-to-reward profile for periods ranging from one week to five years.
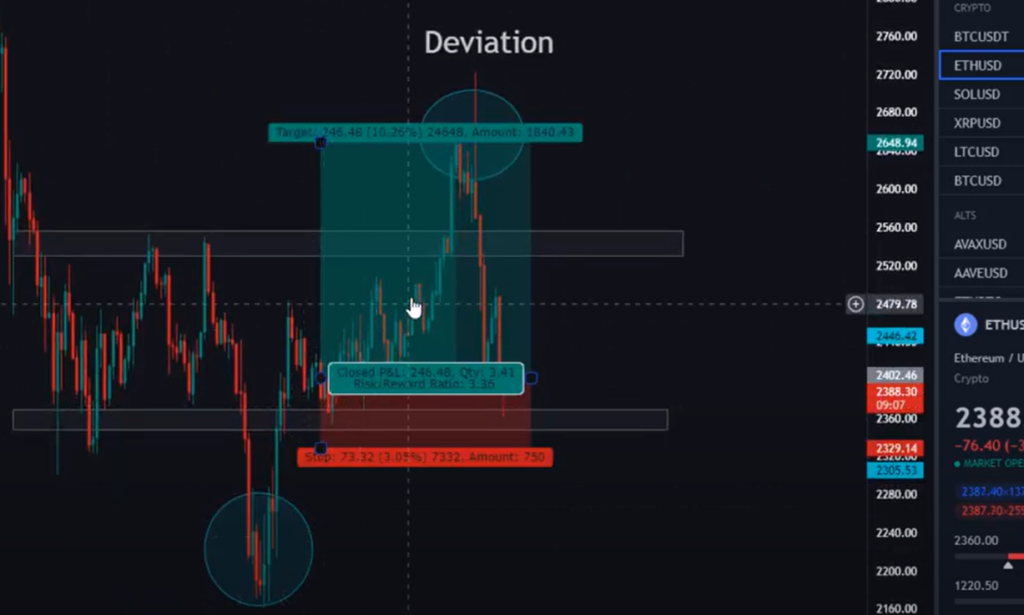
When trading Forex, it is important to be aware of the concept of deviation.
In order to understand deviation, it is first necessary to have a basic understanding of how currency pairs are quoted in the Forex market.A currency pair is typically quoted at two prices: a bid price and an ask price. The bid price is the price at which a trader can sell a currency pair, and the ask price is the price at which a trader can buy a currency pair [1].
In the world of Forex, deviation is a term used to describe the difference between the expected and actual values. In most cases, deviations occur when there is an unexpected event that impacts the market.
For example, if there is a natural disaster in a major trading hub, it can cause a deviation in currency prices. In this blog post, our Forex experts will discuss what deviation is and how it affects Forex traders.
What Is Deviation In Forex?
If you’ve ever traded in the stock market, then you know that a dramatic increase in volatility may close out a near-to-profitable trade as a loss. That’s where the typical deviation comes into play; it establishes the currency pair’s inherent volatility before an order is placed.
The standard deviation is a statistical term that measures the variance of a data set from its average value. In other words, the greater the distance a value falls away from its mean, the higher its standard deviation. This method is often used to analyze many fields, such as healthcare, education, and population studies.
In the realm of Forex, the deviation is most often defined as a volatility measurement. Traders employ it to compare current price action in light of a normal or average value by establishing a regular closing price’s relationship to an average or mean value. These straightforward actions are required to achieve this:
- Defining a set of closing prices based on time or some other regularity;
- Finding the mean value of a defined data set;
- The dispersion, or difference between the closing price and the mean value, is measured;
Because standard deviation is so difficult to calculate in real-time, manually doing so in a live Forex environment is impossible. Fortunately, most trading systems provide a deviance tool that performs the calculations automatically — in real-time.
Bollinger Bands and the Standard Deviation Indicator are two of the most widely used deviation tools [2].
Why Is Standard Deviation Important In Forex Trading?
Standard deviation stands for a statistic that quantifies price volatility, assessing how far prices are dispersed from the average price. A higher standard deviation means that prices are more volatile, while a lower standard deviation indicates less volatility.
In other words, if the current price is deviating too much from the average price (as shown by a high standard deviation), it might be time to sell. On the other hand, if there’s not enough deviation (low standard deviation), it might be time to buy.
This is because when prices are far from the average, they’re more likely to return back to it — and that’s where profits can be made. By using standard deviation in your trading strategy, you can set more accurate stop-losses and take-profits, which will improve your risk-reward ratio [3].
How To Use Standard Deviation In Forex Trading?
The standard deviation is a tool/method/technique for quantifying price volatility by comparing a range to its moving average [4]:
- The greater the indicator’s value, the wider the spread between price and its moving average, the more volatile the commodity, and the more dispersed the price bars become;
- The spread between the price and its moving average is lower when the indicator is low. The instrument’s value is more stable, and the bars are closer to each other as the indicator decreases;
- The standard deviation of a security’s price increases as the market becomes more chaotic. When the price action dies down, the standard deviation falls;
- When the price moves with a larger standard deviation, it indicates that the market is displaying above-average strength or fragility;
- Volatility spikes in the stock market’s middle stages are generally associated with nervous and indecisive traders;
- A bull market’s top is a sign of maturity. Markets with decreasing volatility over extended periods of time indicate maturing bull markets;
- Over a long period, low volatility bottoms suggest traders who are bored and uninterested;
- When a stock’s price swings rapidly up and down over a short amount of time, it indicates panic selling;
The standard deviation can, therefore, be used as a measure of market sentiment. When the market is said to be “bullish”, it means that prices are expected to rise – when the market is “bearish”, it means that prices are expected to fall.
The standard deviation can also be used to determine support and resistance levels. These levels are where the price has a tendency to stop or reverse when it gets too far away from the average price.
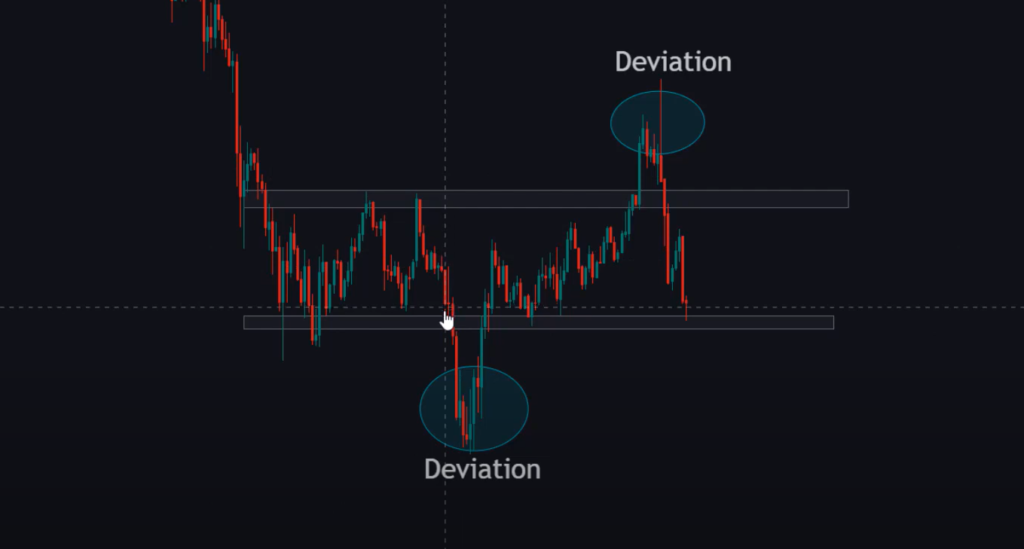
Forex Deviation Levels
In order to trade with deviation, you must first understand what it is and how to identify it. Deviation in Forex is simply the difference between the current price and its average value over a period of time. You can use this concept to gauge market volatility and make better-informed trading decisions.
There are two types of deviation
High Deviation
A high standard deviation indicates that the current closing price is distant from the average and that volatility is high. The spread between ask and bid prices frequently widens, and chart bars will be elongated. This may be because of a breakout or a large number of undecided traders.
Low Deviation
The narrower spread variation indicates lower volatility and closeness to the average price. When the deviation is low, spreads are usually tighter, and charts will generally be flat. This might be due to a lack of participation, spotty pricing, or a forthcoming breakout [5].
High deviations usually occur during periods of high volatility when the market is experiencing a lot of movement. This can be caused by a number of factors, such as a breakout or a large number of undecided traders. When there is a high deviation, you will see that the spread between the ask and bid prices frequently widens and that chart bars are elongated.
Low deviations, on the other hand, occur during periods of low volatility when the market is not experiencing much movement. This can be caused by a lack of participation, spotty pricing, or a forthcoming breakout. When there is a low deviation, you will see that the spread between the ask and bid prices is narrower and that chart bars are generally flat.
Knowing how to identify high and low deviations can help you make better-informed trading decisions and take advantage of market conditions.
How To Calculate Standard Deviation?
There are a few different ways to calculate Standard Deviation. The most common way is to use Excel or another statistical software package like Minitab. You can also use a graphing calculator, but this method is less common [6].
To calculate Standard Deviation using Excel, first enter your data into a column. Then, click on the “Data” tab and then select “Data Analysis”. Select “Standard Deviation” from the list of options and click “OK”. Your results will be displayed in a new window.
Graphing calculators can also be used to calculate Standard Deviation. To do this, first, enter your data into the calculator. Then, press the “STAT” button and scroll down to choose “calc”. Scroll over to “Standard Deviation” and press enter. Your results will be displayed on the screen.
No matter which method you use, calculating Standard Deviation is a relatively simple process. And, understanding Standard Deviation is essential for any Forex trader who wants to be successful.
Deviation And Broker’s Fraud
Slippage is significant since the trader may receive discriminatory pricing on execution. The broker can make a profit with the trader’s money, which eliminates risk. If the broker handles orders differently after the market has moved in favor of or against the trader, it may be termed asymmetric slippage. This unethical behavior is referred to as fraud.
Always check for slippages on a live account rather than a demo one. The total number of slips should be calculated over many transactions.
If the quantity of negatives is greater, it’s an indication that something isn’t right [7].Although testing for slippage costs money, it may be deemed an investment for future higher-cost orders. This guarantees that your broker is legitimate and operating lawfully with you.
The previous several years have seen Forex brokers become considerably superior, with low slippage.
FAQ
What is the best deviation in Forex?
The answer to this question is difficult to quantify as it will differ from trader to trader and also depends on market conditions.
A good rule of thumb, however, is to keep your deviation relatively tight – around two standard deviations – during periods of high volatility and wider. And around three or four standard deviations – during periods of low volatility.
Of course, there are always exceptions to the rule and some traders find success by deviating further from the average.
What’s the deviation on MT5?
The difference is shown in MT5 as price volatility. The standard deviation indicator of an asset’s recent moves in MT5 measures the degree of change. The spread widens if the indicator value increases.
MT5 platforms enable users of all levels to trade a variety of assets, including futures, stocks, and even Forex trading robots. MetaTrader is one of the most popular trading platforms.
A deviation in MetaTrader occurs when a price slip happens in a trading platform. MT4 and MT5 are the most frequent types of MetaTrader platforms.
The user may define the slippage deviation on these platforms using options supplied by the program. These systems include features and methods from the Forex market, as well as parameters control settings.
Deviation in MT5 is just like in MT4, and there may be some pips slippage during high volatility. Even though numerous articles suggested that the advantage of the MT5 platforms was low slippage, expert testing revealed no difference between MT4 and MT5 [9].
Traders choose MT5 since it offers a wide range of financial instruments, which is why Forex robots are common. The maximum slippage amount in one’s account can be limited by setting and choosing the maximum deviation on the MT5 platform. Traders can enable maximum deviation limits for pending orders, market orders, and signal source-placed orders in the MQL5 community to avoid situations like this one. When a trader activates the maximum deviation setting, their transactions will not go through if there is any slippage.
How do you set a deviation in Forex?
There is no one-size-fits-all answer to this question, as the best deviation level for you will depend on your individual trading style and goals. However, a good starting point is to set your deviation at two standard deviations during periods of high volatility and three or four standard deviations during periods of low volatility. Again, it’s important to experiment with different levels to see what works best for you in any given market environment.
If you’re using a MetaTrader platform, such as MT4 or MT5, you can set your deviation level in the “Slippage” tab under “Options”. Simply select the maximum amount of slippage you’re willing to accept for each type of order (market, pending, or stop-loss/take-profit).
Note that setting a higher deviation will decrease the chances of your order being filled, but it may help to avoid slippage during periods of high volatility.
Ultimately, the best way to find the right deviation level for you is to experiment with different settings and see what works best in any given market environment.
What is the maximum deviation?
The maximum deviation is a client-defined setting on the client’s terminal that controls the maximum price difference (in pips) between the execution price and the requested price when opening and closing a position [10].
How do you turn on maximum deviation?
To set the maximum deviation on your trading platform, you need to:
- Go to the “Tools” menu;
- Click on “Options”;
- Select the “General” tab;
- Under “Maximum Deviation”, enter the desired value;
- Click “OK” to save your changes;
What is a 3 standard deviation move?
The most common number of days in a row moving in the same direction is 7 – it occurs one time in four. The standard deviation for this case would be 3 standard deviations, which would include the fewest occurrences of seven or more days going forward in the same direction.
As you can see, the greatest number of instances will generally correlate with what we anticipate, while the lowest number of events will correspond to outliers [11].
How is market deviation calculated?
There are two ways to calculate the standard deviation of a return series: using daily returns or using monthly returns.
To calculate the standard deviation of daily returns, take the square root of the variance of the return series.
To calculate the standard deviation of monthly returns, multiply the square root of the variance of the return series by the square root of 12 [12].
Useful Video: Trading DEVIATIONS | High Probability Trading Strategy | Forex & Crypto
References:
- https://www.Forextraders.com/Forex-education/Forex-technical-analysis/standard-deviation-indicator/
- https://www.danielstrading.com/2019/04/10/what-is-deviation-in-Forex
- https://www.babypips.com/Forexpedia/standard-deviation
- https://www.babypips.com/Forexpedia/standard-deviation
- https://www.Forex.com/en/market-analysis/latest-research/what-is-deviation-in-Forex/
- https://www.babypips.com/Forexpedia/standard-deviation
- https://www.Forex.in.rs/deviation-in-metatrader/
- https://www.fxtradingrevolution.com/Forex-blog/why-traders-need-to-understand-the-twist-and-turns-of-standard-deviation
- https://www.Forex.in.rs/deviation-in-metatrader/
- https://www.lawinsider.com/dictionary/maximum-deviation
- https://www.tastytrade.com/concepts-strategies/standard-deviation
- https://school.stockcharts.com/doku.php?id=technical_indicators:standard_deviation_volatility