
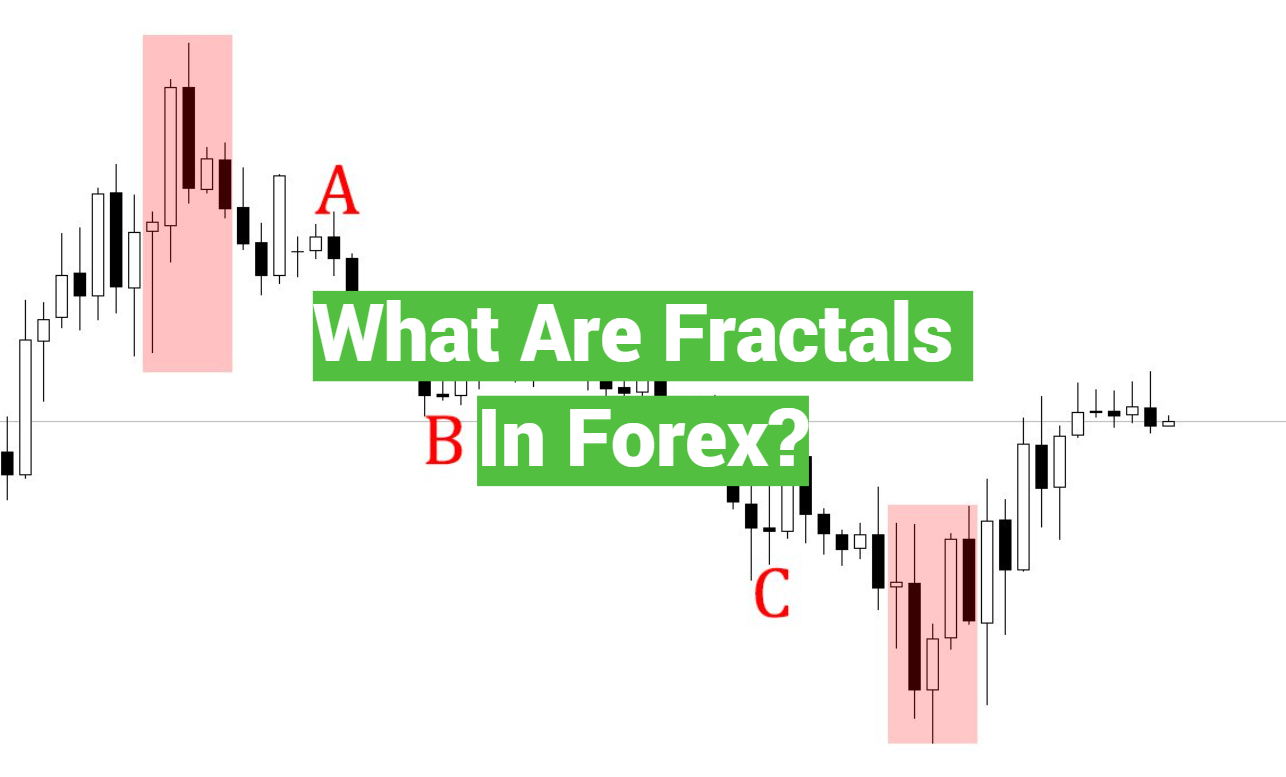
Fractals are a fascinating mathematical concept that has gained popularity in the world of forex trading. In simple terms, fractals are patterns that repeat themselves on different scales, creating a self-similar structure. This means that no matter how much you zoom in or out, the pattern will still look the same. The idea of fractals was first introduced by Benoit Mandelbrot in the 1970s and has since been applied to various fields, including finance.
In forex trading, fractals are used as a tool to identify potential trend reversals. When a fractal pattern appears, it indicates that a trend may be changing direction. The pattern consists of five bars, with the middle bar being the highest or lowest in the set. If the pattern appears above the price level, it is considered a bearish signal, suggesting that the market may be about to enter a downtrend. Conversely, if the pattern appears below the price level, it is considered a bullish signal, suggesting that the market may be about to enter an uptrend.
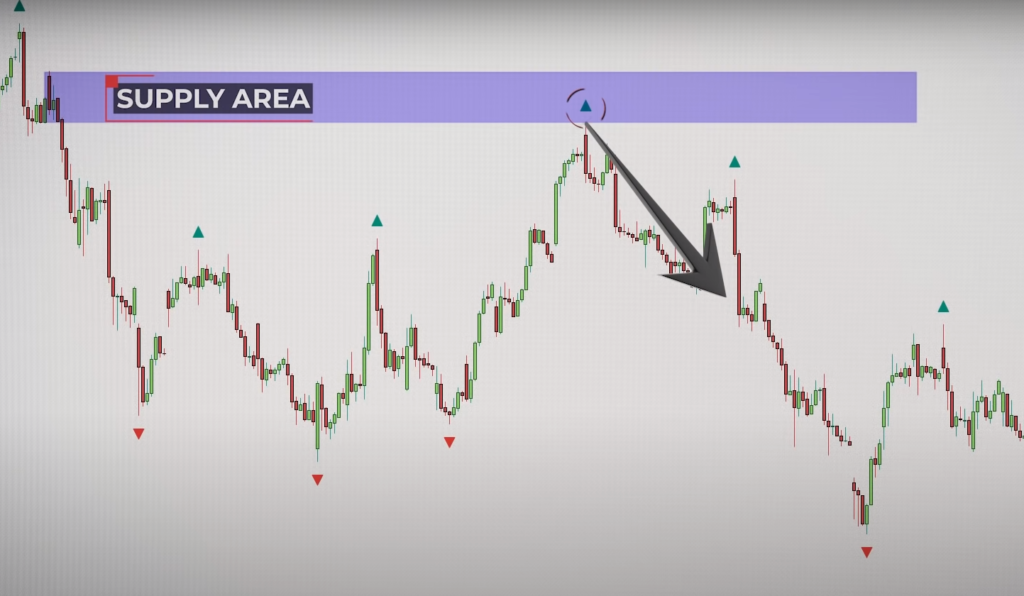
Fractals can be a useful tool for traders because they help to identify key levels of support and resistance in the market. These levels can be used to set stop-loss orders and take-profit targets, which can help to manage risk and maximize profits. Additionally, fractals can be used in conjunction with other technical indicators, such as moving averages and trendlines, to confirm signals and improve the accuracy of trading decisions.
In this article, we will delve deeper into the concept of fractals and how they can be applied to forex trading. We will explore the different types of fractals, how to identify them on price charts, and how to use them in trading strategies. By the end of this article, you will have a better understanding of how fractals can be a valuable tool for traders looking to improve their trading performance.
Introduction to Forex Fractals
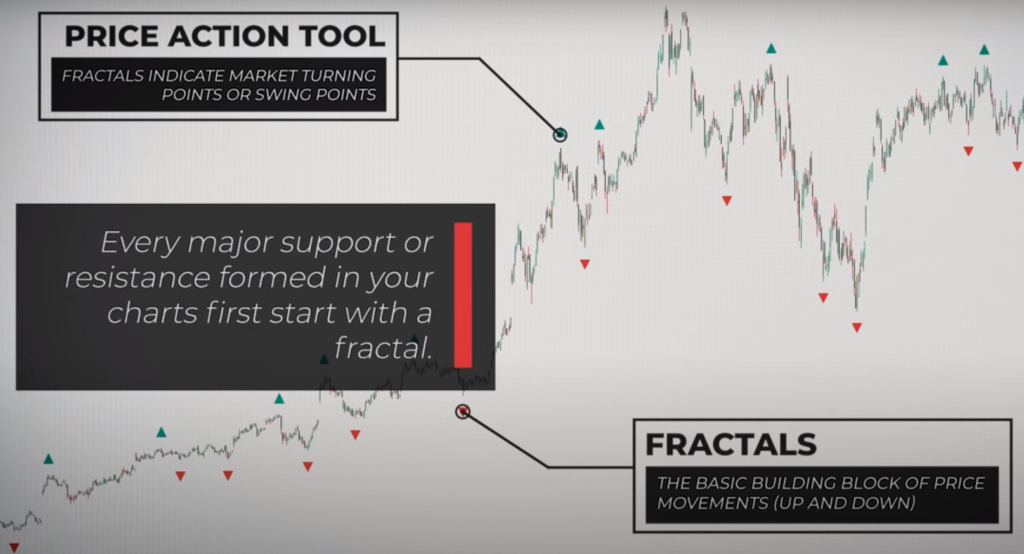
Forex trading involves the buying and selling of currencies, with the aim of making a profit from the fluctuations in their prices. To be a successful trader, you need to have a good understanding of the market and the tools available to you. One such tool is the forex fractal. A fractal is a pattern that repeats itself on different scales. In forex trading, a fractal refers to a price pattern that appears on a chart and indicates a reversal in the market.
Formation of an Up Fractal
An up fractal is a pattern that appears on a chart and indicates a potential reversal in a downtrend. The formation of an up fractal requires at least five candles. The first candle is a bearish candle, followed by three bullish candles, and finally, another bearish candle. The fifth candle must close, and its high must be higher than the high of the two preceding candles, while its low must be higher than the low of the two preceding candles [1].
Once the fifth candle has closed, a fractal has been formed. The fractal indicates that there is potential for the market to reverse from a downtrend to an uptrend. However, it is important to note that the formation of a fractal does not guarantee a reversal. It is merely an indication that traders should be cautious and monitor the market closely.
Fractal Indicators Can Be Used to Determine the Market Direction
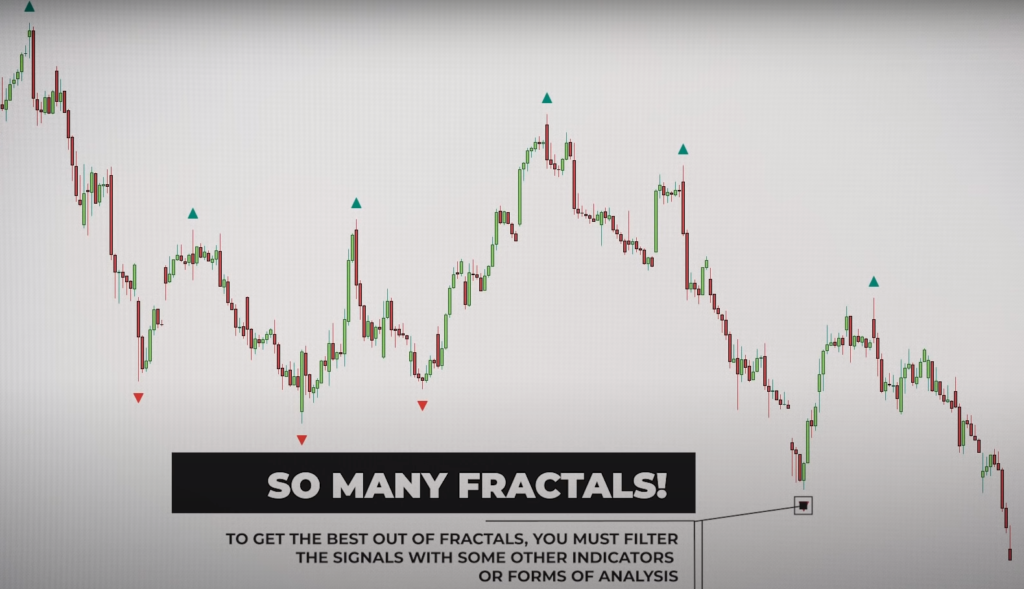
Fractal indicators can be used to determine the direction of the market. A fractal indicator plots fractals on a chart, indicating potential reversal points. The fractals appear as arrows pointing up or down, indicating an up fractal or a down fractal.
Traders can use fractal indicators to identify the direction of the market and trade accordingly. For example, if the fractal indicator shows a series of up-fractals, it indicates that the market is in an uptrend, and traders should look for buying opportunities. Conversely, if the fractal indicator is showing a series of down fractals, it indicates that the market is in a downtrend, and traders should look for selling opportunities.
Using Fractals for Stop Loss Placement
Fractals can also be used for stop-loss placement. Stop loss is an order placed with a broker to sell a security when it reaches a certain price. It is used to limit losses in a trade. Using fractals for stop-loss placement can help traders determine the optimal level to set their stop loss.
When trading in an uptrend, traders can place their stop loss below the last down fractal. This is because if the market breaks below the last down fractal, it indicates a potential reversal in the trend, and the trader may want to exit the trade.
Similarly, when trading in a downtrend, traders can place their stop loss above the last up fractal. This is because if the market breaks above the last up fractal, it indicates a potential reversal in the trend, and the trader may want to exit the trade.
Detecting Patterns in Price Movements
For example, a head and shoulders pattern consists of three peaks, with the middle peak being the highest. The pattern indicates a potential reversal in the trend. Traders can use fractals to identify the peaks and the potential reversal points.
Applying Fractals to Trading
Fractals can be a powerful tool when applied to trading. Traders can use fractals to identify potential entry and exit points in a trade. For example, when trading in an uptrend, traders can look for up-fractals as potential entry points. Conversely, when trading in a downtrend, traders can look for down fractals as potential entry points.
Traders can also use fractals to identify potential exit points. For example, when trading in an uptrend, traders can look for down fractals as potential exit points. Conversely, when trading in a downtrend, traders can look for up-fractals as potential exit points.
Fractals can also be used in conjunction with other technical indicators, such as moving averages and oscillators, to confirm trading signals. For example, if the fractal indicator is showing an up fractal, and the moving averages are showing a bullish crossover, it provides a strong bullish signal, indicating a potential buying opportunity.
How To Use Fractals In Forex Trading?
Fractals are a type of technical indicator that is based on price patterns. They are used to identify potential reversals in the market. A fractal consists of five or more bars, where the middle bar is the highest or lowest in the sequence. The fractal is considered to be complete when the bar to the left and right of the middle bar have lower highs or higher lows.
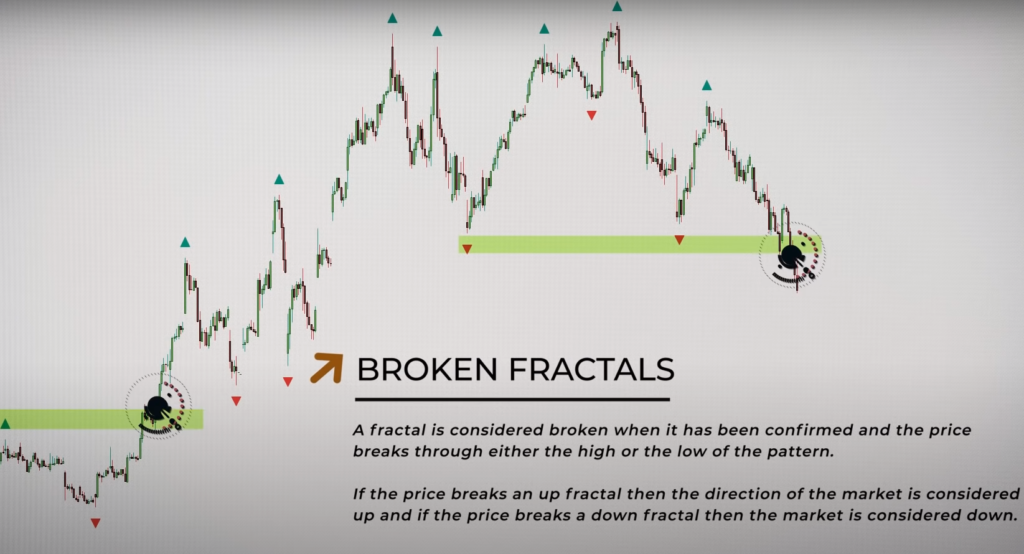
1) Broken Fractals
A broken fractal occurs when the market fails to confirm a fractal pattern. This happens when the market moves beyond the highest high or lowest low in the fractal sequence. A broken fractal is a strong signal that the market is likely to continue in the direction of the breakout.
2) Coupling With Other Indicators
Fractals can be used in combination with other technical indicators to confirm signals. For example, a trader might use fractals in conjunction with moving averages or the Relative Strength Index (RSI) to confirm a trend reversal. By coupling fractals with other indicators, traders can improve their accuracy in predicting market movements.
Forex Fractals Strategies
Traders can use many different strategies with fractals. Here are a few practical examples:
Scalping Trades In Fractal Zones
Scalping is a trading strategy that involves making small profits on frequent trades. In this strategy, traders use fractals to identify potential entry and exit points for trades. The idea is to enter a trade when the market is in a fractal zone, which is an area where fractals are forming frequently. Traders then use a tight stop loss and take profit to make small gains on each trade.
Rebound From Fractals And Zigzag Indicator
Another strategy that traders can use with fractals is to combine them with the Zigzag indicator. The Zigzag indicator is used to identify trend reversals. When combined with fractals, traders can identify potential entry and exit points for trades.
For example, if the market is in a downtrend and a fractal forms at a lower low, traders can use the Zigzag indicator to confirm the reversal and enter a long position.
How To Calculate The Fractal Indicator?
The Fractal indicator in Forex is calculated based on a specific pattern of price movement in the market.
Here are the steps to calculate the fractal indicator [2]:
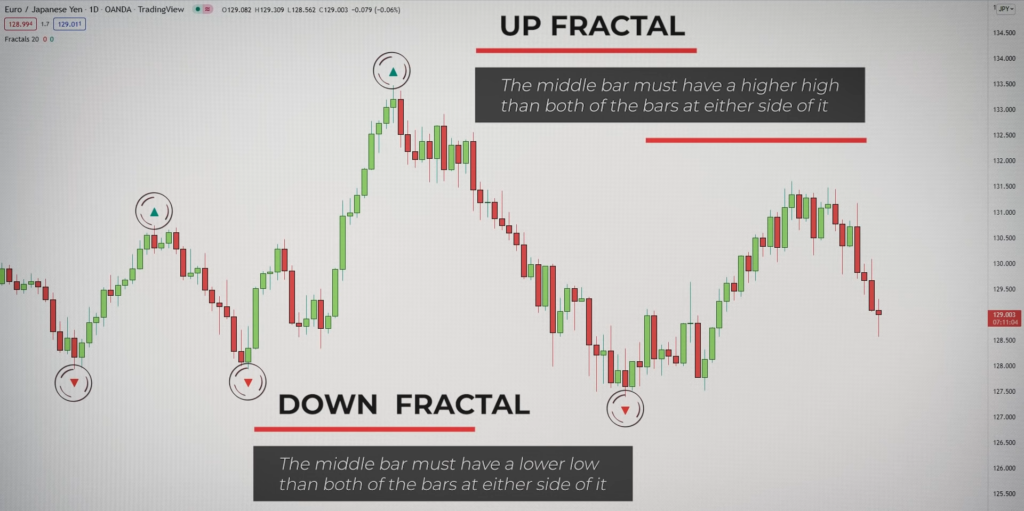
- Identify a bullish or bearish Fractal pattern. A bullish Fractal pattern consists of at least five consecutive bars, where the highest high is in the middle, and two lower highs on each side. A bearish Fractal pattern consists of at least five consecutive bars, where the lowest low is in the middle, and two higher lows on each side;
- Once the pattern is identified, the Fractal indicator is plotted on the chart. The indicator consists of an up arrow above the candlestick or bar for a bullish Fractal and a down arrow below the candlestick or bar for a bearish Fractal;
The Fractal indicator can be used to identify potential reversal points in the market, and traders can use it in conjunction with other technical indicators and fundamental analysis to make informed trading decisions.
Tips for users: Fractal indicator is available as a standard indicator in trading platforms like MT4 and MT5, so traders do not need to manually calculate it themselves.
The Difference Between The Fractal Indicator And Chart Patterns
The Fractal indicator and chart patterns are both technical analysis tools used by Forex traders, but they have some key differences.
The Fractal indicator can be used to inform trading decisions and identify potential entry or exit points [3].
Chart patterns, on the other hand, are visual patterns that form on a price chart. They can be bullish or bearish and can provide clues about the direction of price movement in the market. Chart patterns include head and shoulders, double tops and bottoms, triangles, and flags, among others. Traders use chart patterns to identify potential trading opportunities and inform their trading decisions.
The key difference between the Fractal indicator and chart patterns – a fractal indicator is a specific technical indicator that is based on a specific pattern of price movement, while chart patterns are visual patterns that form on a price chart. While both tools can be used to identify potential reversal points in the market, the Fractal indicator is more precise in its identification of these points, while chart patterns can provide a broader indication of potential price movement.
Limitations Of Using The Fractal Indicator
While the Fractal indicator can be a useful tool for Forex traders, it also has some limitations that traders should be aware of [4]:
- Repainting: One of the major limitations of the Fractal indicator is that it can repaint, which means that the indicator can change its position on the chart after it has been plotted. This can make it difficult to use the indicator for making trading decisions;
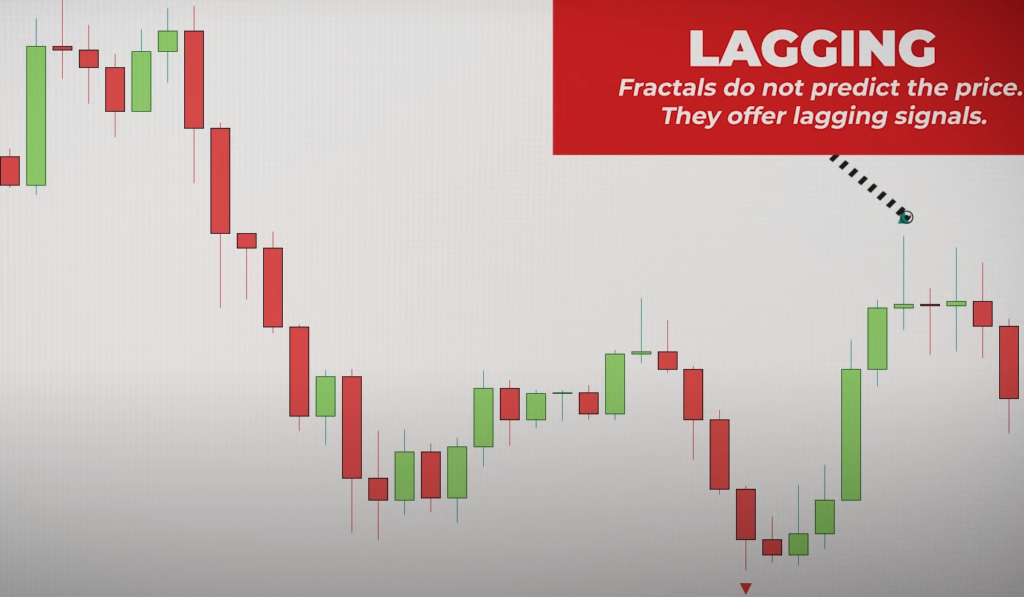
- Lagging indicator: The Fractal indicator is a lagging indicator, meaning that it is based on past price movements in the market. This means that it may not always provide accurate signals for future price movements, especially during periods of high volatility or sudden market changes;
- False signals: Like all technical indicators, the Fractal indicator can provide false signals that can lead to incorrect trading decisions. This can happen when the market is choppy or there is no clear trend in place;
- Over-reliance: Traders who rely too heavily on the Fractal indicator may miss other important market signals or fundamental factors that can affect price movement in the market;
- Requires skill and experience: To effectively use the Fractal indicator, traders need to have a good understanding of technical analysis, as well as experience in interpreting market signals and making trading decisions;
How To Use The Fractals Indicator?
The Fractal indicator can be a useful tool for Forex traders to identify potential reversal points in the market.
Here are some steps for using the Fractal indicator [5]:
- Open the Fractal indicator: The Fractal indicator is available as a standard indicator on most Forex trading platforms, including MT4 and MT5. Open the indicator and apply it to your chart;
- Identify potential reversal points: The Fractal indicator identifies potential reversal points in the market based on patterns of five or more consecutive bars with specific high or low price points. A bullish Fractal pattern consists of at least five consecutive bars, where the highest high is in the middle, and two lower highs on each side. A bearish Fractal pattern consists of at least five consecutive bars, where the lowest low is in the middle, and two higher lows on each side;
- Confirm signals: Once a Fractal pattern is identified, traders should confirm the signal using other technical indicators, fundamental analysis, and market knowledge to make informed trading decisions. This can include using other technical indicators like moving averages, trend lines, or oscillators to confirm the signal;
- Set entry and exit points: Once a Fractal signal is confirmed, traders can use it to set entry and exit points for their trades. This can include setting a stop loss and taking profit levels based on the potential price movement indicated by the Fractal signal;
- Monitor the trade: Once a trade is entered, traders should continue to monitor the market to ensure that the trade is moving in their favor. They can use the Fractal indicator, as well as other technical indicators and fundamental analysis, to make adjustments to their trade as needed;
Fractals Indicator Forex Strategy
The fractal indicator is a popular technical analysis tool used by Forex traders. It is a type of pattern that occurs on a price chart and indicates a potential reversal in the trend [6]. The fractal consists of five or more bars, where the middle bar is the highest or lowest in the sequence. The fractal is considered to be complete when the bar to the left and right of the middle bar have lower highs or higher lows.
How To Filter Fractal Signals?
The fractal indicator is often used in combination with other technical indicators, such as moving averages or trend lines. This can help traders filter out false signals and improve the accuracy of their predictions.
Here are a few strategies for filtering fractal signals:
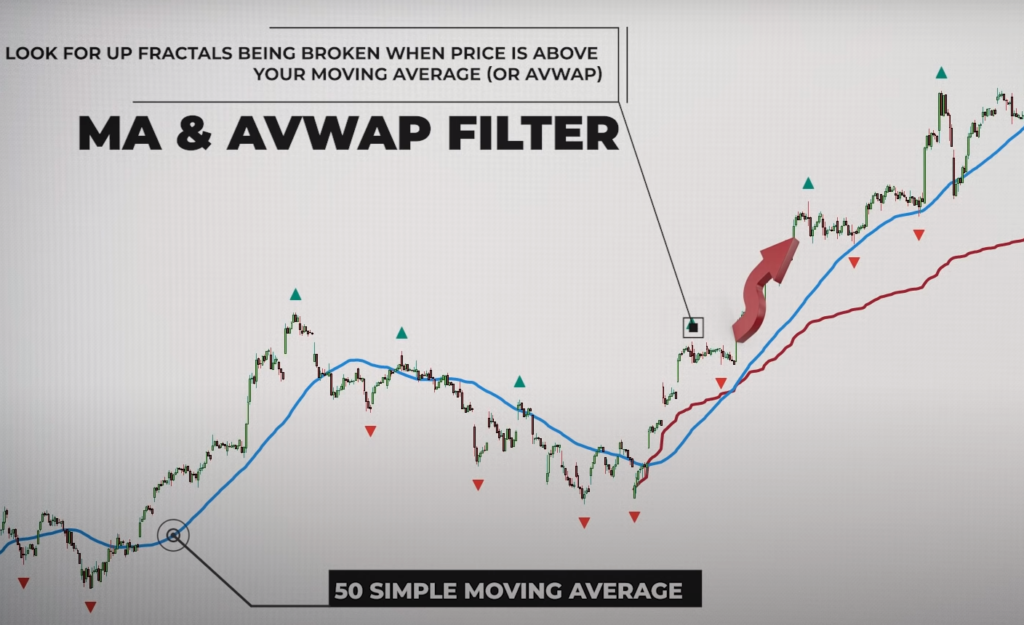
- Moving Averages
Moving averages are a popular technical indicator used to identify trends. By using a moving average in conjunction with the fractal indicator, traders can filter out false signals and confirm the trend. For example, if the market is in an uptrend, traders can look for fractals that occur above the moving average. Conversely, if the market is in a downtrend, traders can look for fractals that occur below the moving average.
- Trend Lines
Trend lines are another technical indicator that can be used to filter fractal signals. Trend lines are drawn on a price chart to identify support and resistance levels. Traders can use trend lines in conjunction with the fractal indicator to identify potential entry and exit points for trades. For example, if the market is in an uptrend and a fractal occurs above a trend line, this can be a strong signal to enter a long position.
- Relative Strength Index (RSI)
The Relative Strength Index (RSI) is a technical indicator used to measure the strength of a trend. By using the RSI in conjunction with the fractal indicator, traders can filter out false signals and confirm the trend.
For example, if the market is in an uptrend and a fractal occurs above the 70 levels on the RSI, this can be a strong signal to enter a short position [7].
A Few Rules For Using Fractals
While the fractal indicator can be a powerful tool, it is important to follow a few rules to use it effectively:
- Wait For Confirmation
Before entering a trade based on a fractal signal, it is important to wait for confirmation. This can be done by using other technical indicators or waiting for the price to break out of a support or resistance level.
- Use a Stop-Loss
A stop loss is an important risk management tool that can help limit losses. When trading with fractals, it is important to use a stop loss to protect against sudden price movements.
- Use A Take Profit
A take profit is a target price that a trader sets to close a trade at a profit. When trading with fractals, it is important to use a take profit to lock in profits and avoid holding a losing trade for too long.
Example of a Fractal Indicator Forex Strategy
Now that we’ve discussed how to filter fractal signals and a few rules for using fractals, let’s look at a practical example of a fractal indicator Forex strategy [8].
Step 1: Identify the Trend
The first step in this strategy is to identify the trend. This can be done by using a moving average or trend line.
Step 2: Look for Fractals
Once the trend has been identified, the next step is to look for fractals. For this strategy, we will use a combination of the alligator indicator and the fractal indicator. The alligator indicator consists of three lines: the jaw, the teeth, and the lips. When the lines are intertwined, it indicates that the market is in a range. When the lines are apart, it indicates that the market is trending.
Step 3: Wait for Confirmation
Before entering a trade based on a fractal signal, it is important to wait for confirmation. In this strategy, we will wait for the price to break out of a support or resistance level before entering a trade.
Step 4: Set Stop Loss and Take Profit
When entering a trade based on a fractal signal, it is important to use a stop loss and take profit to manage risk. For this strategy, we will use a 50-pip stop loss and a 100-pip take profit.
FAQ:
- What are the different types of fractals in Forex?
Fractals are geometric patterns that repeat themselves at different scales. In Forex, there are two main types of fractals [9]:
- Bullish fractals: these patterns signal a potential bullish trend reversal. A bullish fractal forms when there are at least five consecutive bars, with the highest high in the middle, and two lower highs on each side;
- Bearish fractals: these patterns signal a potential bearish trend reversal. A bearish fractal forms when there are at least five consecutive bars, with the lowest low in the middle, and two higher lows on each side;
- Why should I use fractals in Forex trading?
Fractals can be useful in Forex trading because they can help identify potential trend reversals. By identifying bullish and bearish fractals, traders can enter or exit trades at the right time, potentially maximizing profits and minimizing losses.
- Which trading platforms offer fractals for trading?
Most trading platforms offer fractals as a technical indicator, including MetaTrader 4 (MT4), MetaTrader 5 (MT5), TradingView, and NinjaTrader.
- How do fractals work in Forex?
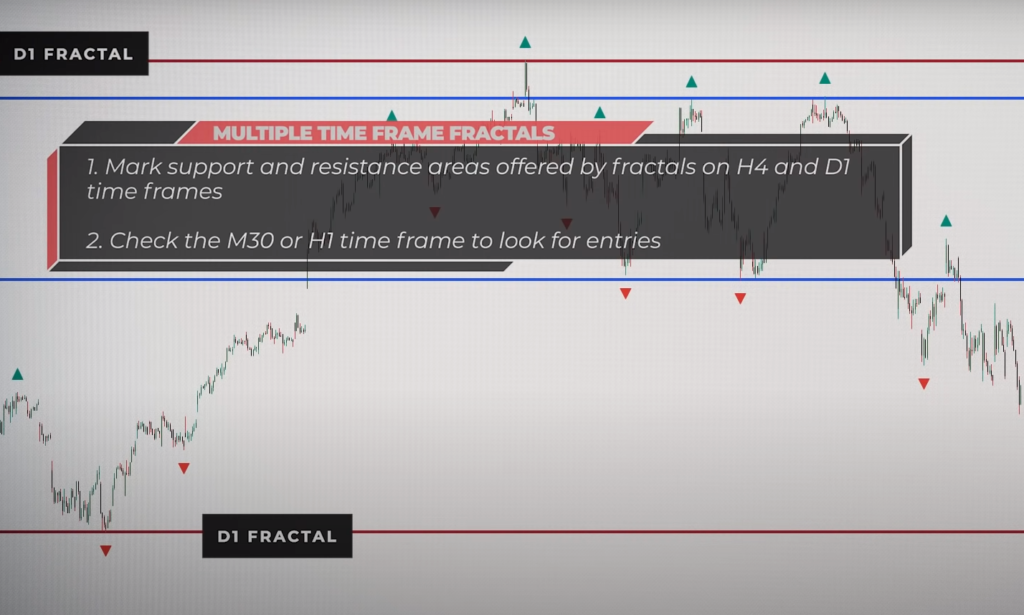
Fractals work by identifying key levels of support and resistance in the market. When a fractal appears, it indicates that the market may be reversing at that level, and traders can use this information to enter or exit trades.
- When should I start fractals?
Fractals can be used at any time in Forex trading, but they may be more effective in trending markets. It is important to use fractals in conjunction with other technical indicators and fundamental analysis to make informed trading decisions.
- What are 5 examples of fractals?
Examples of fractals include the Koch snowflake, the Sierpinski triangle, the Mandelbrot set, the Julia set, and the Cantor set.
- What is fractal in MT4?
In MT4, the fractal indicator identifies bullish and bearish fractals. It highlights potential reversal points in the market and can be used to inform trading decisions [10].
- What are the two most important properties of fractals?
The two most important properties of fractals are self-similarity and scale invariance. Self-similarity means that the same pattern repeats itself at different scales, while scale invariance means that the pattern looks the same regardless of the scale at which it is observed.
- What are the most simple fractals?
The simplest fractals include the Koch curve and the Cantor set.
- What is the formula for a fractal pattern?
There is no specific formula for fractal patterns, as they are created through iterative processes.
- Are Fibonacci fractals?
Fibonacci retracements and extensions are not considered fractals, but they can be used in conjunction with fractals to identify potential levels of support and resistance.
- What is the golden ratio in fractals?
The golden ratio, also known as phi (φ), is a mathematical constant that is often found in nature and in art [11]. It is often used in conjunction with fractals to create visually pleasing patterns.
- Are fractals good for trading?
Fractals can be a useful tool for trading, but they should be used in conjunction with other technical indicators and fundamental analysis to make informed trading decisions.
- Is fractal a good indicator?
Fractal can be a good indicator for identifying potential trend reversals, but it should not be used in isolation. Traders should use fractals in conjunction with other technical indicators and fundamental analysis to make informed trading decisions.
- What is the most accurate Forex indicator?
There is no single most accurate Forex indicator, as different indicators can be more or less effective in different market conditions. It is important to use a combination of technical indicators, fundamental analysis, and market knowledge to make informed trading decisions.
- What is the most trusted indicator for Forex?
There is no single most trusted Forex indicator, as traders have different preferences and trading styles. Popular technical indicators include moving averages, relative strength index (RSI), and stochastic oscillators.
- What is the difference between fractals and Fibonacci?
Fractals and Fibonacci retracements and extensions are both technical indicators used in Forex trading, but they have different applications. Fractals are used to identify potential trend reversals, while Fibonacci retracements and extensions are used to identify potential levels of support and resistance.
- What is Fractal indicator MT4?
The Fractal indicator in MT4 identifies potential bullish and bearish fractals in the market, highlighting key levels of support and resistance.
- What are fractals in MT5?
Fractals in MT5 are a technical indicator that identifies potential trend reversals in the market, based on patterns of five or more consecutive bars with specific high or low price points. The indicator can be used to inform trading decisions and identify potential entry or exit points.
Useful Video: You Won’t Believe The Power Of Market Fractals
References:
- https://learn.tradimo.com/technical-analysis-how-to-work-with-indicators/fractals-indicator
- https://www.axiory.com/trading-resources/technical-indicators/fractal-indicator
- https://www.investopedia.com/articles/trading/06/fractals.asp
- https://paxforex.org/forex-blog/what-are-fractals-in-forex-trading
- https://fbs.com/analytics/guidebooks/fractals-251
- https://www.litefinance.org/blog/for-beginners/forex-fractals-strategy/
- https://www.babypips.com/forexpedia/fractal
- https://www.investopedia.com/terms/f/fractal.asp
- https://www.icmarkets.com/blog/using-fractals-in-the-forex-market/
- https://www.tradingpedia.com/forex-trading-strategies/trading-forex-using-fractals/
- https://theforexgeek.com/fractals/